Skip to content

Data Scientist · AI/ML Engineer

I build intelligent systems that turn data into decisions.

I work across machine learning, statistical analytics and predictive modelling — from automated ETL and feature engineering through model benchmarking, to SHAP-based explainability, Monte Carlo simulation and generative AI layered into applications people can actually use.

Machine Learning · Statistical Modelling · Explainable AI · Generative AI · Data Analytics · Intelligent Applications

Recruiter? Get the 2-minute overview →

Yash Modi in a navy suit for his professional portfolio.
Bharuch, Gujarat, IndiaAvailable
0

Engineered Features

Churn Risk Intelligence System

0

Classification Models Benchmarked

Logistic · Tree · Forest · Boosting

0

Evaluation Metrics

Accuracy · Precision · Recall · F1 · ROC-AUC

0

Monte Carlo Trials per Prediction

CricAnalytics simulation engine

0%

Defect Rate Reduction

Lean Six Sigma DMAIC study — 8% to 2%

GCP

Cloud Deployment

Google Cloud Run

Selected Work

A selection of data, AI, statistical and analytical systems I have designed and built.

01 — Featured

Predictive Churn Risk Intelligence System

Retail Banking · Machine Learning · Risk Analytics

A full-stack churn prediction system for retail banking that moves from raw customer data through an automated ETL pipeline to explainable risk scores, AI-generated retention strategies and a supervisory report.

Engineered features
18
Engineered features
Models benchmarked
4
Models benchmarked
Evaluation metrics
5
Evaluation metrics
Explainability
SHAP
Explainability
  • Python
  • Scikit-learn
  • SHAP
  • Gemini API
  • ETL Pipeline Design
  • Financial Risk Analytics
  1. 01Customer Data
  2. 02ETL
  3. 0318 Engineered Features
  4. 04Model Benchmarking
  5. 05Best Model
  6. 06SHAP Explainability
  7. 07Risk Segmentation
  8. 08Gemini Recommendations
  9. 09Decision Support
System architecture — illustrative diagram of the churn intelligence pipeline.
02 — Featured

CricAnalytics

Sports Intelligence · Statistical Modelling · Predictive Simulation

A statistical match-prediction platform that runs 5,000 parallel Monte Carlo trials per prediction over 1,000+ historical IPL matches, combining ELO ratings, hypothesis testing and EMA-based season forecasting in a React interface.

Monte Carlo trials
5,000
Monte Carlo trials
Historical matches
1,000+
Historical matches
IPL seasons
19
IPL seasons
Significance test
Two-tailed Z
Significance test
  • Python
  • React 18
  • Monte Carlo Simulation
  • Z-Test
  • ELO Rating
  • Recharts
  • Tailwind CSS
SIMULATED OUTCOME5,000 TRIALS
Illustrative distribution shape — not output from a specific match run.
03 — FeaturedGold Medal · 1st Rank

Defect Reduction & Operational Efficiency

Manufacturing · Lean Six Sigma DMAIC · Quality Analytics

A Lean Six Sigma DMAIC study on the Medium Casing transformer line at Atlanta Electricals Pvt. Ltd. Real defect records were cleaned in pandas/NumPy, ranked with Pareto and 6M root-cause analysis, prioritised with FMEA, and converted into SOPs, Poka-Yoke controls and a 5S programme — cutting the defect rate from 8% to 2% and monthly cost of poor quality from ₹76,000 to ₹22,000.

Defect rate
8% → 2%
Defect rate
Monthly COPQ
₹76K → ₹22K
Monthly COPQ
Cycle time
−40%
Cycle time
Recognition
Gold Medal
Recognition
  • Lean Six Sigma
  • DMAIC
  • Python
  • Pandas
  • NumPy
  • Pareto Analysis
  • FMEA
  • SPC
  • 5S
4126221795WORKMANSHIPDESIGNMATERIALASSEMBLYTESTINGOTHERS120 DEFECTS RECORDEDTOP 2 = 56% CUMULATIVE
Pareto ranking of the 120 recorded defect events at Atlanta Electricals — workmanship and design issues alone account for 56% of all defects.

Also built

Machine Learning · Classification · NASA Open Dataset

Hazardous Asteroid Detection Model

A binary classification model on NASA's near-Earth object dataset that prioritizes recall, because in hazard detection a missed positive costs far more than a false alarm.

  • Python
  • Pandas
  • Scikit-learn
  • Logistic Regression
  • Matplotlib

Dashboards & BI

Dashboards & Business Intelligence

Turning raw data into clear insights through data visualization, interactive reporting, and analytical storytelling.

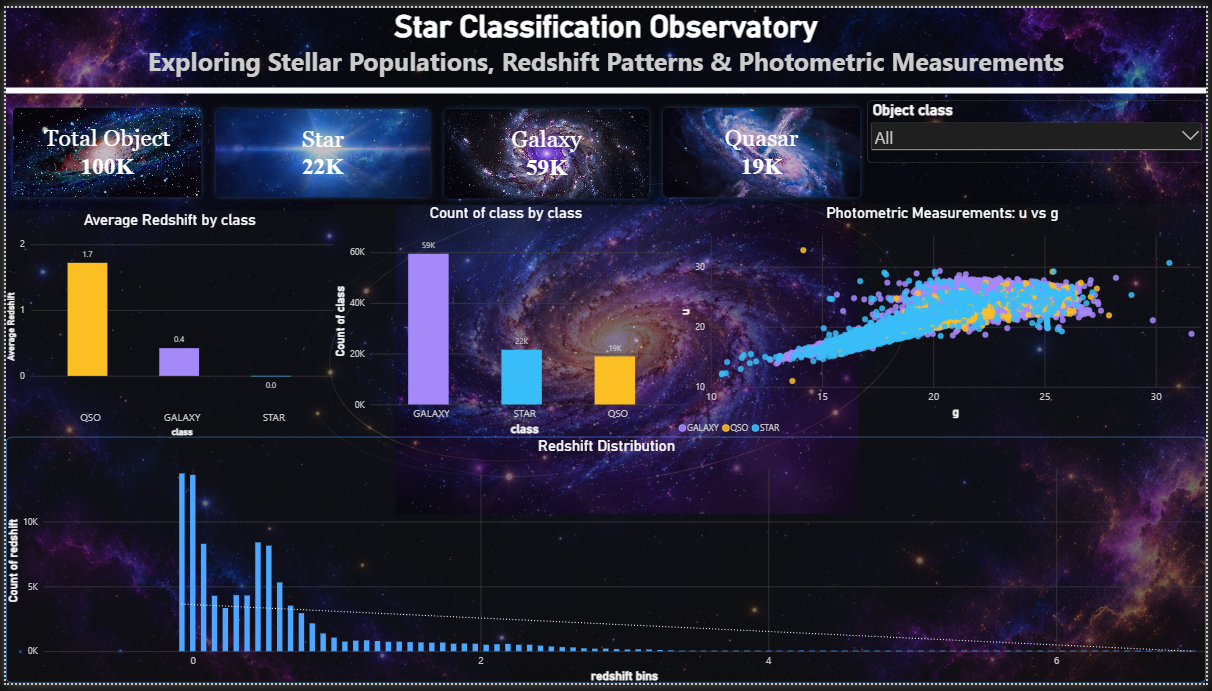
Power BI Star Object Classification Dashboard preview

Astronomy & Data Analytics

Star Object Classification Dashboard

A Power BI dashboard for exploring and visualizing astronomical object data. The report preview should help visitors understand the classification-focused analysis.

  • Power BI
Dashboard Preview

How I Work

Curious by nature. Analytical by discipline.

A consistent approach from an unclear business question to an explained, deployed output someone can act on.

  1. 01

    Understand the Problem

    Frame the decision that needs to be made before touching a dataset. Who acts on the output, and what changes if the model is right?

  2. 02

    Explore the Data

    Structured EDA: distributions, missingness, leakage checks, and the relationships that actually carry signal.

  3. 03

    Build the Baseline

    A simple, interpretable baseline first. Every later gain has to justify itself against it.

  4. 04

    Model

    Feature engineering and benchmarking across model families rather than committing to one algorithm early.

  5. 05

    Validate

    Multiple metrics chosen for the cost of error — recall where misses are expensive, ROC-AUC for ranking quality.

  6. 06

    Explain

    SHAP attributions, partial dependence and statistical tests so a reviewer can audit why a prediction was made.

  1. 07

    Deploy

    Package the model into an application people can actually use — interfaces, simulators and cloud deployment.

  2. 08

    Support the Decision

    Translate output into recommended action, risk segments and reports written for the person making the call.

Yash Modi in a professional work environment.
Work · ContextFocused · Deliberate

About Yash

A quantitative foundation in Physics. A practical focus in Data Science.

I'm Yash Modi — a Data Scientist and AI/ML Engineer from Bharuch, Gujarat. I build systems that take noisy, real-world data and turn it into explained, actionable decisions recruiters, stakeholders and decision-makers can trust.

I trained as a physicist — an M.Sc. in Spectroscopy built on statistical analysis, quantitative reasoning and the interpretation of experimental data. That work is where I learned to treat measurement error, uncertainty and evidence as first-class parts of a conclusion rather than footnotes.

I moved into Data Science through a Post Graduate Diploma, where I finished first in class, and applied the same discipline to commercial problems: retail banking churn risk, manufacturing defect reduction, statistical sports simulation and open-data classification.

Turning complex data into structured thinking, practical analysis, and meaningful decisions.

Education

  • Post Graduate Diploma in Data Science

    Sardar Patel University, Vallabh Vidyanagar

    GPA 7.7 / 10 · First Rank in Class

  • M.Sc. in Physics (Spectroscopy)

    Maharaja Sayajirao University, Vadodara

    Quantitative foundation

Technical Focus

  • Machine Learning
  • Statistical Modelling
  • Predictive Analytics
  • Explainable AI
  • Generative AI
  • Monte Carlo Simulation
  • ETL & Feature Engineering
  • Cloud Deployment

Domains

Banking Risk · Sports Intelligence · Manufacturing Quality · Open-Data Classification

Working Approach

  1. M.Sc. Physics
  2. PG Diploma in Data Science
  3. Machine Learning
  4. Explainable AI / Generative AI
  5. Analytics Applications
  6. Deployment
Yash Modi professional portrait.
Yash ModiData Scientist · AI/ML Engineer

Technical Toolkit

Capabilities, tied to where I have used them.

Grouped by what the tools do rather than displayed as a logo wall.

Machine Learning

  • Scikit-learn
  • Logistic Regression
  • Decision Trees
  • Random Forest
  • Gradient Boosting
  • Predictive Modelling
  • Explainable AI
  • SHAP

SHAP — explainable customer risk predictions

Data Engineering

  • ETL
  • Feature Engineering
  • Data Preprocessing
  • Data Validation
  • Quality Assurance
  • Anomaly Detection

Automated ETL pipeline with 18 engineered features

Data & BI

  • Python
  • SQL
  • Power BI
  • Tableau
  • Advanced Excel
  • Matplotlib
  • Seaborn
  • Recharts

Recharts — interactive analytics interfaces

AI

  • Generative AI
  • Gemini API
  • Prompt Engineering
  • IBM Generative AI

Gemini API — AI-generated retention recommendations

Statistics

  • EDA
  • Hypothesis Testing
  • Z-Test
  • ROC-AUC
  • Partial Dependence Plots
  • Monte Carlo Simulation
  • Box-Muller Transform
  • Probability Distributions
  • Statistical Modelling
  • SPSS
  • Econometrics

Monte Carlo — 5,000 trials per match prediction

Engineering & Deployment

  • React.js
  • JavaScript
  • Vite
  • Tailwind CSS
  • Google Cloud Platform
  • Cloud Run

GCP Cloud Run — cloud deployment

Professional Methods

  • Lean Six Sigma
  • DMAIC
  • Agile Analytics
  • Responsible AI
  • Data Governance

DMAIC — manufacturing defect root-cause analysis

Recognition

Evidence, awards and applied outcomes.

Gold Medal · 1st Rank

Awarded for the Defect Reduction & Operational Efficiency study at Atlanta Electricals Pvt. Ltd., which cut the defect rate from 8% to 2% and monthly cost of poor quality from ₹76,000 to ₹22,000.

First Rank in Class

Post Graduate Diploma in Data Science — GPA 7.7 / 10, with GPA 8.2 / 10 and First Rank in the first semester.

Two self-directed full-stack analytics platforms

Banking Risk Intelligence and Monte Carlo Sports Intelligence, designed and built end to end.

GCP Cloud Deployment

Application deployment experience on Google Cloud Platform using Cloud Run.

Industry-recognized certifications

Programmes from Google, IBM, Microsoft, CFI and Yale across data science, AI and finance.

Currently Building

Commercial Real Estate Market Analytics

A property valuation and financial forecasting platform built in Python and Excel, covering market comparables, cash-flow modelling and scenario-based valuation.

IN PROGRESS · 2026

Portfolio Brief

Looking for the fastest way to review my work?

A three-page executive overview: positioning, proof metrics, flagship work, how I approach problems, toolkit, education and recognition. Readable in the browser, printable to PDF, no email required.

Get My Portfolio Brief

Contact

Let's build something intelligent.

I am open to Data Science, AI/ML and analytics roles where the work involves real modelling, intelligent data products and business-oriented analytical problems. If there is a fit, I would be glad to talk.